Sometimes we can too quickly say “No” when we should take a moment to think about whether we can actually say “Yes”. This was one of those times for me.
We had just gone live with a fairly big system move + upgrade – a suite of APEX applications shifted from one database instance running APEX 5 to another instance running version 19.1. The migration went smoothly. After the new instance was released to the business to do some final shakedown testing, they noticed one problem:
“All our saved reports are gone.”
Oops. We had built the new instance by simply importing each application from source control; since these scripts don’t include the Saved Report formats that users had customised in many of the Interactive Reports in prod, they didn’t get migrated to the new database.
When they asked if we can transfer the saved reports across, I initially replied, “Sorry, we can’t” – thinking that redoing the migration from scratch with a full export from the old database, followed by re-doing all the app changes, was going to take too much time and effort.
A minute later, I sent another email. “Hold that thought – there is a way.” I’d forgotten that my script for exporting the applications uses an APEX API with some parameters that until now I’d rarely used, but which would solve our problem. My script included this:
I call this the “Yes” script. Using this “Yes” script, we performed the following steps:
Log into the schema on the old database (we hadn’t shut it down yet, thankfully – we’d just locked the schemas and set all the applications to “Unavailable”)
Run the “Yes” script. Rename the resulting export files, e.g. f100_ir.sql, f110_ir.sql, etc.
Log into the new database.
Run the IR scripts (f100_ir.sql, etc.). This reverted all the applications to their old versions, but they included all the user’s saved reports.
Re-import the new versions of the applications from source control. This upgraded all the applications, leaving the user’s saved reports intact.
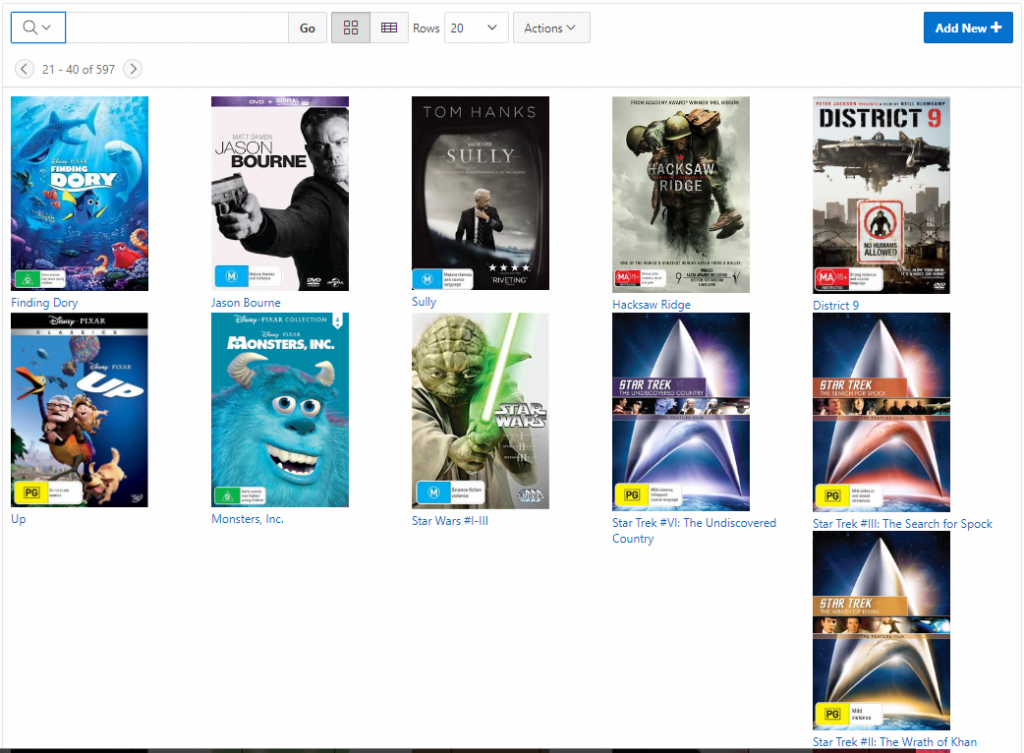
I had an interactive report an an old APEX application that I’ve kept maintained for quite a few years, which is able to show an Icon View that shows a thumbnail of the image for each item.
The problem was that the layout sometimes went wonky depending on the size of the image or the size of the label text. How the items were laid out depended on the width of the viewing window as well. I have set Columns Per Row to 5, and I’m using a Custom Icon View with the following Custom Link:
Each item shows an image, scaled down to width 140 pixels (my images come in all sorts of sizes), plus the title; either the title or the image may be clicked to open the details for it.
This is how it looked:
Depending on a number of variables (length of the label text, and the width of the viewing window) some rows would show their first item in the 5th column instead of over on the left; this would have a run-on effect to following rows. In addition, I wasn’t quite happy with the left-justified layout for each item.
To fix this I added some DIVs and some CSS. My Custom Link is now:
Some of the key bits here are that the container div has width and height attributes, and the image is constrained using max-width, max-height, width:auto and height:auto. Also, the work title is constrained to a 40 pixel high block, with overflow:hidden.
My report now looks like this:
The images are scaled down automatically to fit within a consistent size, and both the images and the labels are horizontally centered leading to a more pleasing layout. If an image is already small enough, it won’t be scaled up but will be shown full-size within the available area. Also, the label height is constrained (if an item label is too high the overflow will be hidden) which solves the layout problem I had before. If the image is not very tall, the label appears directly beneath it which is what I wanted.
The only remaining issue is that the icon view feature of the interactive report generates a table with rows of a fixed number of columns (5, in my case), which doesn’t wrap so nicely on a small screen when it can’t fit 5 in a row. I’ve set Columns Per Row to 1 now, and it seems to wrap perfectly; it shows up to a maximum of 6 items per row depending on the viewing window width.
POSTSCRIPT – Lazy Load
Thanks to Matt (see comment below) who pointed out that a report like this would benefit greatly from a Lazy Load feature to reduce the amount of data pulled to the client – for example, if the user requests 5,000 records per page and starts paging through the results, each page view could potentially download a large volume of data, especially if the images are quite large. I’ve implemented this now and it was quite straightforward:
Upload the file jquery.lazyload-any.js to Static Application Files
Add the following to the page attribute File URLs: #APP_IMAGES#jquery.lazyload-any.js
Add a Dynamic Action to the report region: Event = After Refresh Action = Execute JavaScript Code Code = $(".workicon").lazyload() Fire on Initialization = Yes
Modify the Icon View Custom Link code to put the bits to lazy load within a script tag of type “text/lazyload” (in my case, all the html contents within the “workicon” div), e.g.:
This was an important addition in my cases as some of the images were quite large; I don’t have to worry about load on my server because they are hosted on Amazon S3, but I do have to pay a little bit for the transfer of data.
A common requirement is to format data for display in an Interactive Report, for example showing an icon, making part of the data a clickable link or a button, or showing it in different colours.
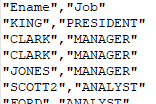
The problem with embedding formatting in the data for the report is that it is not only used for display in the web page; it is also used for the Download option, causing user confusion when HTML code is exposed in the generated CSV file.
If the logic for the formatting is not data-driven, the solution is to enter the HTML in the HTML Expression attribute on the report column definition. The HTML Expression is used only when displaying the data in the interactive report; the underlying column data is used for the Download. The underlying column data is also used to generate the filter list for the column (if Column Filter Type is “Default Based on Column Type”).
If the logic for the formatting is data-driven, a simple solution is to generate the HTML in an underlying column in the query. However, you don’t want this HTML appearing in the Download CSV, so what you can do is generate the HTML in an additional, hidden column in the report; then use the hidden column in the HTML Expression attribute. This works because the HTML Expression attribute is allowed to refer to any column in the query, even hidden ones.
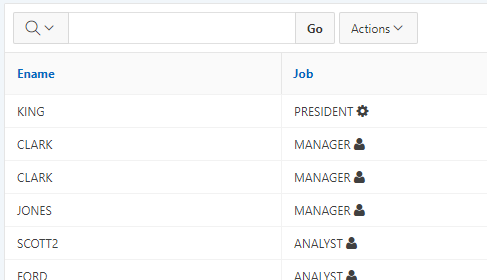
For example, here is a query with a generated column that determines an icon to be displayed within the “job” column:
select ename,
       job,
       job
       || ' <span class="fa '
       || case when mgr is null then 'fa-gear' else 'fa-user' end
       || '"></span>' as job_html
from emp
The following column attributes are set:
JOB: HTML Expression = #JOB_HTML#
JOB_HTML: Type = Hidden Column
When the report is run, we see the icons displayed:
When the report is downloaded as CSV, the Job column is plaintext as desired: