
APEX Map Region vs. Google Map Plugin
Within the APEX development team it has been known for some time that maps are frequently required and this has been on the roadmap to be built in to the core product.
Since 2016 I have built and maintained plugins that make it easy to integrate Google Maps in your APEX applications. The most popular of these is the ReportMap Plugin which has received a wealth of features and enhancements, and is being used widely.
Introducing: Map regions
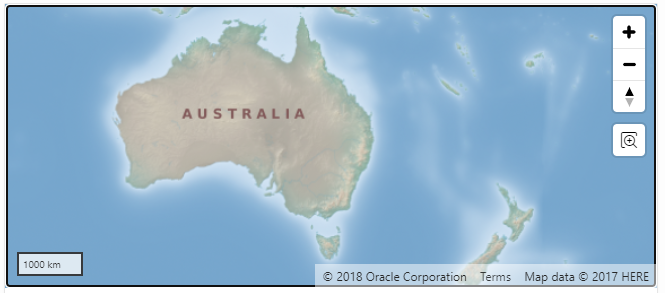
In the latest pre-production release APEX 21.1 which you can try today for yourself at apex.oracle.com, the APEX development team has introduced the new Map region. This component allows the developer to show a world map on the page, and add one or more “Layers”, each based on a table or SQL query, to show features on the map.
This is a welcome move because it means maps will be easy for all APEX developers to use, including those who avoid plugins (e.g. due to the lack of direct support from Oracle). It also means that maps added to applications based on the core feature will be fully supported in future releases of APEX without needing to rely on a 3rd party.
Note: this post is based solely on my first impressions of the new feature and is not intended to answer all questions about it. There will be more official blog posts coming directly from the APEX development team about this and other new features being introduced in APEX 21.1, so keep a look out for those!
The APEX Map region renders the map using the MapBox API, with a number of tile backgrounds included based on OpenStreetMap and HERE map data.
Implementing a Map Region
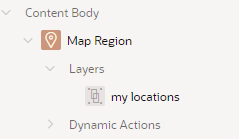
Let’s try the new Map region, and compare it to the jk64 ReportMap plugin. To add a map to a page, I added a region of type “Map” and nominated a data source for the Layer to show on it.
First thing you might notice is what I didn’t need:
- no 3rd party plugin to install
- no account on a 3rd party cloud service
- no API key, and no APIs need to be enabled
- no credit card details
The Map region is free to use within your applications, just like any other built-in feature of APEX.
If you already have a map based on the ReportMap plugin, you can if you wish convert it to a map by simply changing the region Type to Map – the SQL data source will be preserved and you can use the same query for the new Map region type. However, the danger with this approach is that you may lose some attributes and customisations that you had on the plugin region. Instead, I recommend using the Duplicate feature to create a copy of your map region, change the attributes on the copy, using the original as a reference as you go. Once you’re happy with the new map you can then delete the original plugin region.
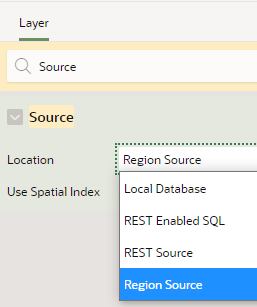
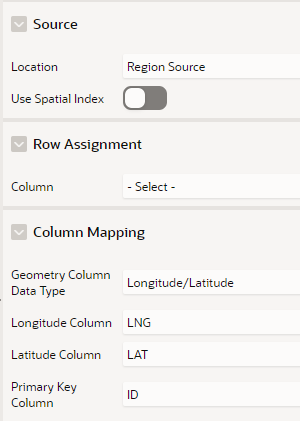
You can choose to set the data source directly on each Layer (e.g. if you want to get data from multiple data sources), or you can set the data source on the map Region. If you set it on the Region, each Layers may refer to the Region data source by setting the layer’s Location attribute to Region Source.
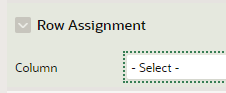
If you have a single data source that you want to split up into multiple Layers, you can set the Row Assignment column which will be used to differentiate the data for each layer. This would be more efficient than adding separate SQL queries for each layer if the queries are based on the same table or view.
The first thing I noticed when converting my demo application was that since my data source was based on an APEX collection, the Lat and Lng columns are strings, not numbers; to use this as a data source for the Map region I had to convert the strings to numbers first using TO_NUMBER.
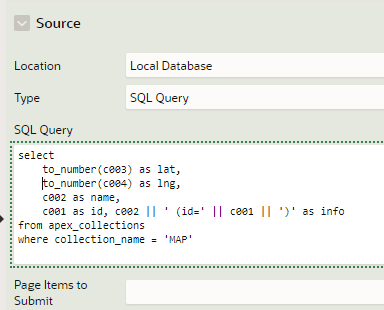
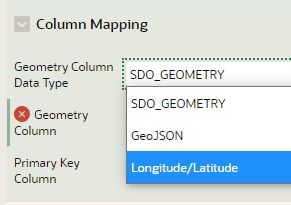
Once that was done, I could map the LAT and LNG columns to the layer by setting the Geometry Column Data Type to Longitude/Latitude:
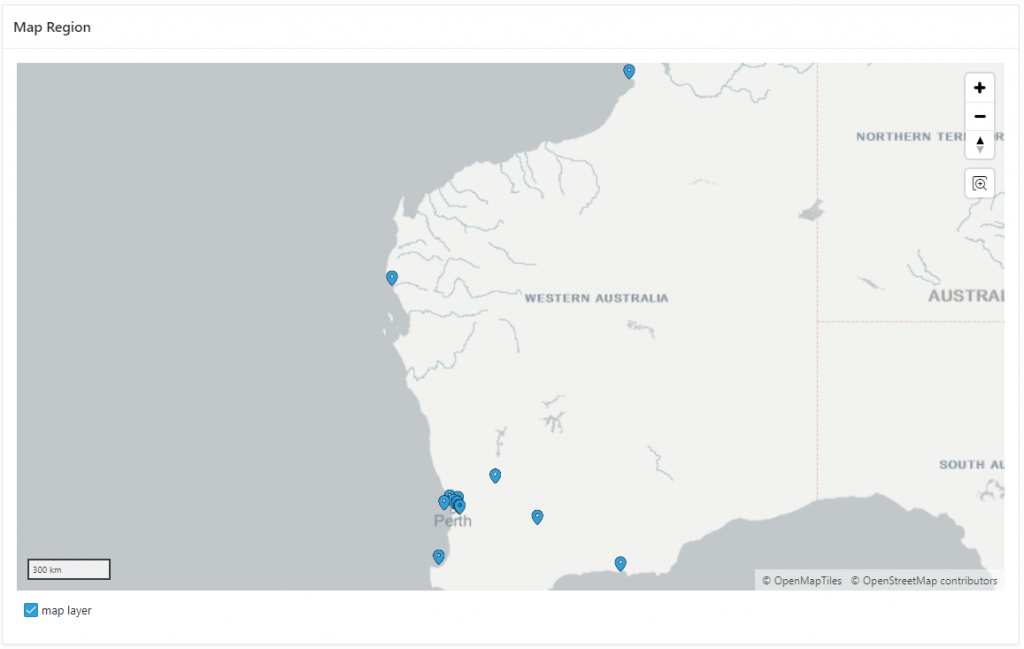
This is the result:
I wanted to style it as close as possible to my plugin demo so I tweaked a few attributes on the Region:
- Appearance / Template Options / Remove Body Padding = on
- Region Attributes:
- Background = Custom
- Standard (tile background) = Oracle World Map
- Height =
350 - Controls / Options / Mousewheel Zoom = on
- Legend / Show = off
- Layer Attributes:
- Point Objects / Shape Scale =
1.5 - Appearance / Fill Color =
#e21818(reddish) - Tooltip / Column =
NAME - Info Window / Title Column =
NAME - Info Window / Body Column =
INFO
- Point Objects / Shape Scale =
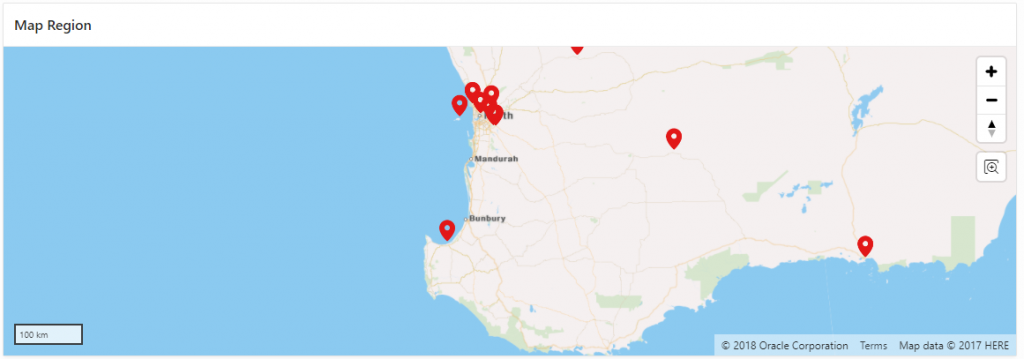
Much nicer colours, in my humble opinion 🙂
Map Dynamic Actions
The next thing I need to do is handle click events on the pins. To do this, I added a Dynamic Action to the map region, on the event Map Object Clicked.
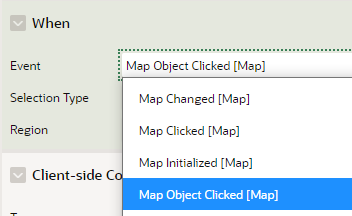
Notice that the Map region can trigger the following events:
- Map Initialized – the map has loaded, including all the data
- Map Changed – the user pans the map or zooms in or out
- Map Clicked – the user clicks in the map area (but not on a pin)
- Map Object Clicked – the user clicks on a pin
Whenever I’m experimenting with dynamic actions one of the first things I’ll add is a Action to run this JavaScript:
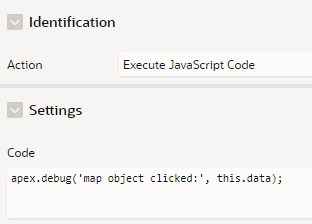
At runtime in debug mode, the console log will then show the content of this.data which shows the structure it takes.

Based on this, I can see that we get the id, infoWindow, lat, lng, and tooltip attributes – similar to the structure provided by the ReportMap plugin events. If I want to display the Latitude and Longitude values on the page, I create a display-only item (e.g. P1_POSITION), and add a “Set Value” action to the dynamic action as follows:
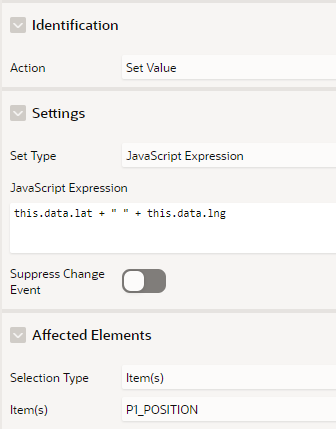
When a pin is clicked, we now see this data on the page:
Of course, we could make this item hidden if we want, and use its value in other ways.
The Map Clicked event returns this.data.lat and this.data.lng to indicate where the user clicked.
The Map Changed event returns:
this.data.changeType– e.g. ‘map-resized’, ‘map-drag’, ‘map-zoom’this.data.bbox– bounding box, an array of numbers of longitudes and latitudes [west, south, east, north]this.data.layers– an array with attributes for each layer (id, name, visible)this.data.bearingthis.data.pitchthis.data.zoom
New Features
The following is a short list of features or enhancements that the new Map region has, which are not (currently) supported by the ReportMap plugin:
- Multiple data layers, each with their own distinct data source; you can also use one SQL query for multiple layers if you want
- REST data sources
- Declarative styles – options for customing how each data layer is rendered, including pin and feature icon, colour and size
- Min/Max Zoom – each layer can be shown or hidden automatically depending on the zoom level (e.g. show a more detailed layer as the user zooms in)
- Legend – each data layer (optionally) can be shown in a legend, allowing the user to selectively show/hide each layer
- Extruded polygons – show a 3D polygon rising from the ground with the height determined by a column from your data source
- Initial Position and Zoom is remembered between page requests
- Circle tool – allows the user to draw a circle on the map; you can then respond to this by filtering data by points that fall within the circle
- Distance tool – allows the user to calculate the distance between two points
Conclusion
That’s page 1 of my side-by-side demo done. Not too shabby!

Only 34 other pages to go over… eventually I plan to release my demo application for you to play with. Some of the demo pages will not be so easy or even possible to replicate, however, until we get the ability to use the Google Maps JavaScript API in the native Map region – so they’ll need to wait for some potential future release.
More posts to come…
Q: Should we switch now, or wait?
If you have a simple map on your page showing some pins, with no custom JavaScript code that provide specific custom behaviour, I think you should consider switching now. Of course, you should make sure to test the new region thoroughly – as with any major new feature, there will be a few bugs here and there. Overall however the Map region looks solid so far and is based on a well-known open source API with a long history.
One of the things to remember if you’re planning to switch from the ReportMap plugin to the new Map region is that not every feature is implemented the same way, and some features are not available at all (at least, not yet, if ever). This is partly because they are based on different JavaScript APIs (Google Maps vs MapBox). In addition, some UI behaviour is different and will likely always be different, although a lot of it will be customisable.
Q: Is this the end for the JK64 ReportMap plugin?
No, the ReportMap plugin is not going away any time soon. I plan to enhance and support it for years to come. My intent is to continue supporting the plugin at least until the APEX Map component supports integration of the Google Maps JavaScript API, and provides declarative support for most (ideally, all) of the declarative features of the ReportMap plugin. I expect that after this, most developers will naturally choose the native Map region over the plugin for new projects, and I’ll only need to provide bug fix support for the plugin while existing users of the plugin migrate gradually to the new component.
I consider this one of the strengths of the plugin system: the APEX development team will never have the capacity to support every last feature needed for every last application built for any customer in the world, so developers and companies should be empowered to create and use plugins to fill those gaps.
These plugins often serve to prove there is demand and need for a particular feature, and this often prompts the APEX development team to consider building these features into the core product, making it better with each release. Exciting times are ahead of us.
About Jeffrey Kemp
Application Designer & Developer at Oracle specialising in Oracle APEX (Application Express), Oracle SQL and PL/SQL. Oracle ACE Alumni ♠️. Piano player, father, husband, Christian. The views expressed on this blog are my own and do not necessarily reflect the views of Oracle.
Stew
29 April 2021 - 7:33 pm
Thanks for the introduction to this new functionality. My employer is VERY cautious about upgrading Oracle/Apex versions (we are on Oracle 12c/Apex 5.0.3 at the moment and will upgrade to Oracle/Apex 19c next month!).
Hopefully I’ll use Apex 21.1 some time before I retire! 😉
In the mean time, I need to create a use-case for a new Apex app that uses ReportMap!
moha
27 May 2021 - 5:20 pm
Thank you .
Can the address be found on the map?
Jeffrey Kemp
27 May 2021 - 5:23 pm
Hi Moha,
Yes, using the Geocoding API calls.
You can get an address for any point on the map with Get Address At Location: https://github.com/jeffreykemp/jk64-plugin-reportmap/wiki/JK64-Report-Google-Map-R1-Action#get-address-at-location
You can get the location for an address or location description with Search Map by Address: https://github.com/jeffreykemp/jk64-plugin-reportmap/wiki/JK64-Report-Google-Map-R1-Action#search-map-by-address
Jeff
Juan Carlos
27 October 2021 - 10:54 am
Hi Jeffrey,
Thank you very much for such a good article.
I have a question about the new apex map region: Is it possible to print a label next to the point? I mean an always-on tag, not a tooltip.
Thank you very much for your help.
Greetings
Juan Carlos
Jeffrey Kemp
27 October 2021 - 12:12 pm
Hi Juan, good question – there’s no declarative “out of the box” option. Might be something worth raising on apex.oracle.com/ideas.
Juan Carlos
27 October 2021 - 3:35 pm
Thanks for your answer.
Do you think it is possible to do it using any API or programming?
Thank you!
Jeffrey Kemp
27 October 2021 - 4:05 pm
I’m not sure – but the MapBox JavaScript API is rich with features so it might be worth looking into.
If you put a static ID on your map region, e.g.
mymap, you can access the map object using:apex.region("mymap").getMapObject()I realise this doesn’t give you what you need but hopefully it gets you on the right track.
Juan Carlos
29 October 2021 - 2:00 pm
Jeffrey, thank you very much for your interest and collaboration.
I hope to find the solution with your kind help.
Greetings!
Nima
19 May 2022 - 2:02 am
Is is possible to use this by providing addresses (street, state, city, country, etc) instead of longitude/latitude? Thank you.
Jeffrey Kemp
19 May 2022 - 8:03 am
Hi Nima – yes you can, whether you use the Google Map Plugin or the APEX Map Region.
If you’re using the APEX map region, you can use the new Geocoded Address item (introduced in APEX 21.2). This allows you to take an address (whether a structured address in multiple fields, or a single address input item) and show its location on the map and retrieve its lat/long coordinates.
Bill Holtzman
15 July 2022 - 3:23 am
Hi Jeff, I’m building a map that displays a series of point representing the path of an aircraft. Is it possible to connect the points with a line? Thanks!
Jeffrey Kemp
15 July 2022 - 11:20 am
To show a series of lines I’d use the GeoJson feature, e.g. if you generate a geojson document like this, with the points in the order you wish to draw them:
{"type":"FeatureCollection","features":[{"type":"Feature","geometry":{"type":"LineString","coordinates":[

[-122.483696, 37.833818],

[-122.483482, 37.833174],

[-122.483396, 37.8327],

[-122.483568, 37.832056],

[-122.48404, 37.831141],

[-122.48404, 37.830497],

[-122.483482, 37.82992],

[-122.483568, 37.829548],

[-122.48507, 37.829446],

[-122.4861, 37.828802],

[-122.486958, 37.82931],

[-122.487001, 37.830802],

[-122.487516, 37.831683],

[-122.488031, 37.832158],

[-122.488889, 37.832971],

[-122.489876, 37.832632],

[-122.490434, 37.832937],

[-122.49125, 37.832429],

[-122.491636, 37.832564],

[-122.492237, 37.833378],

[-122.493782, 37.833683]

]},"properties":{}}]}
Bill Holtzman
15 July 2022 - 3:35 am
Also, is there a way to insert a line feed into the Tooltip?
Jeffrey Kemp
15 July 2022 - 11:03 am
The tooltip can have embedded carriage return characters, e.g. in your query you would do something like:
select lat, lng, line1 || chr(13) || line2 as name, id from mydataVatsa
17 August 2022 - 4:34 am
Jeffrey,
This is fantastic info. Now, I am able to display the coordinates of the clicked location on the map. How can I drop a pin on that clicked location? Your help will be greatly appreciated.
Thanks
Vatsa
Jeffrey Kemp
17 August 2022 - 10:12 am
Hi Vatsa,
If you install the optional plugin “JK64 Report Google Map R1 Action” you can add a dynamic action to Place Marker at the clicked location.
Add the action in response to the mapClick event on the map region.
More info:
Map Click event: https://github.com/jeffreykemp/jk64-plugin-reportmap/wiki/Plugin-Events-Reference#mapclick
Place Marker action: https://github.com/jeffreykemp/jk64-plugin-reportmap/wiki/JK64-Report-Google-Map-R1-Action#place-marker
Jeff
Vatsa
18 August 2022 - 9:30 pm
Hi Jeff,
Can I use that plugin with the map region of APEX or do I have to have Google map in the region?
Thanks
Vatsa
Jeffrey Kemp
18 August 2022 - 9:33 pm
No, the google map dynamic action plugins only work with the google map region plugin.
Vatsa
18 August 2022 - 10:26 pm
Is there a way to drop a pin on the map when I am using the map region of APEX?
Moh
15 November 2022 - 7:40 pm
Is there a way to uplaod a background map in offline?
Jeffrey Kemp
15 November 2022 - 7:42 pm
I’m sorry Moh, I’m not sure what you mean. Can you describe what you’re trying to achieve?
Soumya
17 November 2022 - 11:33 pm
Hi Jeff
Fantastic Article!!
Is it possible to show the distance between two points using oracle apex map region.
Jeffrey Kemp
19 November 2022 - 11:12 am
Hi Soumya,
Yes – if you enable the attribute Distance Tool (map region Attributes -> Controls -> Options). The user then gets a Distance tool icon. They can click the icon, then select a path of 2 or more points on the map. The total distance of the path will be displayed.
You can also set the Unit System (Metric or Imperial) for the displayed distance, or have the Unit System selectable by an item on the page.
Jeff
Soumya
23 November 2022 - 6:33 am
Thanks Jeff, but can we show the exact route from source to destination and the time taken to reach
Jeffrey Kemp
24 November 2022 - 4:14 pm
Hi Soumya,
Out of the box, APEX maps do not support a directions service. The underlying technology is based on mapbox so *maybe* you might be able to use its directions service – https://docs.mapbox.com/mapbox-gl-js/example/mapbox-gl-directions/ – but don’t quote me on that, I haven’t tried it.
Jeff
patrick
5 February 2023 - 5:05 am
Hi Jeff,
One of the key features of the Oracle Map Region is that “Initial Position and Zoom” is remembered between page requests. This is very useful for some cases, but not all.
I would like to be able to reset initial position for each page request, or at least update it based on a page item at each page request.
Is there a way to use a dynamic action to accomplish this?
Thanks,
Jeffrey Kemp
5 February 2023 - 6:31 pm
Hi Patrick,
You can have a dynamic action that runs on the Map Initialized [Map] event that moves the map to the position desired.
The action could run some javascript like this:
apex.region("my-map-region").call( "getMapObject" ).flyTo({center: [ -10.0, -30.5 ],
screenSpeed: 0.8
});
Nic Maclean
18 February 2023 - 5:10 pm
Hi Jeff,
Thanks for your article. Do you know if you can use custom maps? I’m working for British Antarctic Survey and we’d like to plot cruise routes on polar maps so would need to have maps with different projections.
Any thoughts welcome!
Jeffrey Kemp
18 February 2023 - 5:36 pm
I don’t think so, these maps only use the Mercator projection. In your case I would consider using ArcGIS, although it would require some extra work if you want to show their maps within an application.
Prasanta
22 February 2023 - 5:38 pm
Hi Jeffrey,
The circle draw tool is only drawing a pointer, do you know how to retain the circle in the map.
How do I hide the Hole checkbox which is in page 19 of the demo application.
Thanks Prasanta
Suresh
4 September 2023 - 12:43 pm
Hey Jeff
I am using the Drawing & GeoJSON, its great I can use multiple polygons, lines etc.
Is there any way we could different color for different object inside a map region? i.e., one polygon with red and another with blue? You mentioned about featureColorSelected. Not sure how, could you please help?
Jeffrey Kemp
5 September 2023 - 2:57 pm
Hi Suresh,
When using the drawing layer, it uses the default style options for the map. You can change these style options using data.setStyle function, e.g.
//get the map object from the "mymap" plugin region
var map = $("#map_mymap").reportmap("instance").map;
//set the drawing style for all features on the drawing layer
map.data.setStyle({
    fillColor   : "yellow",
    fillOpacity : 0.9,
    strokeColor : "blue"
});
The style options is documented here: https://developers.google.com/maps/documentation/javascript/reference/data#Data.StyleOptions
You would put this in a Dynamic Action on the mapIdle event. This, however, sets the style for all objects on the drawing layer to the same style.
If you want different styles for different features, you can instead supply a Styling Function, e.g.
//get the map object from the "mymap" plugin region
var map = $("#map_mymap").reportmap("instance").map;
//modify the default drawing style using a Styling Function
map.data.setStyle(function(f){
    return {
        fillOpacity : 0.5,
        //pick a random fill colour
        fillColor   : "#" + ((1 << 24) * Math.random() | 0).toString(16).padStart(6, "0"),
        //pick a random line colour
        strokeColor : "#" + ((1 << 24) * Math.random() | 0).toString(16).padStart(6, "0")
    }
});
In this context, "f" is a reference to the feature being added to the map.
I hope this helps!
Jeff
sree
18 January 2024 - 10:09 pm
Hey Jeff,
Thanks for the awesome post!
So, I’ve got this thing going on with two regions.
The first one is a dynamic report that displays names and locations.
The second region is a map.
Whenever I click on a location link in the dynamic report, it successfully shows that location on the map. I’ve got that part working.
Now, here’s where I’m stuck. If I zoom in or change the location on the map, the next time I click on a location, I want it to reset back to the normal zoom and location, or move towards the location I choose. I’ve tried using the Initial Position and Zoom, but no luck so far. Any chance you could give me a hint on how to achieve this?
By the way, I have to say, the map is looking pretty awesome with the settings you provided. Thanks again for the fantastic post!