
ReportMap Release 1.4
Release 1.4 of the JK64 Report Google Map R1 has been released with a number of bug fixes and enhancements. You can review the changes here: https://github.com/jeffreykemp/jk64-plugin-reportmap/releases/tag/v1.4. The most important enhancement is a new Dynamic Action plugin that is included as a recommended companion to the map plugin.
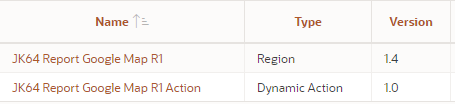
The Dynamic Action plugin, called JK64 Report Google Map R1 Action, allows you to implement any of a range of custom behaviours on your map region. If installed, you can make the map respond to user behaviour or other events without needing to resort to writing your own custom JavaScript.
You can add a dynamic action to modify a variety of options and attributes of the map, execute searches, pan and zoom, load features via geoJson, and more – and these can be based on the value of items on your page, or via JavaScript expressions that you specify.
For example, on the demo Plugin Options, the user can change the map type:
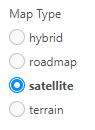
This is implemented as a radio item with a dynamic action on the Change event:
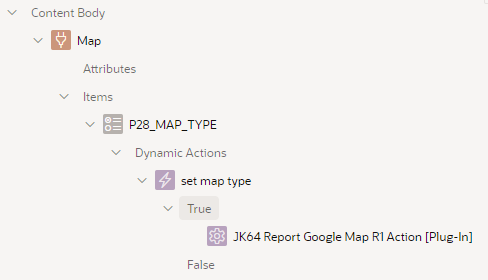
The dynamic action has the following attributes:
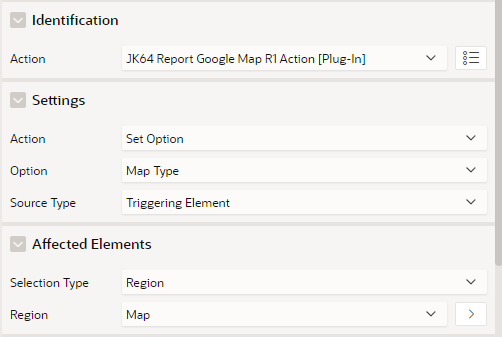
Note that in this case, it sets an Option – Map Type, based on the triggering element (the P28_MAP_TYPE item). The Affected Elements is required, and must refer to the map region that we want to change.
Notice anything missing? That’s right – No Code needed!
The plugin makes it easy to customise which of the default Google Map controls (buttons, etc.) are shown to the user:
- Full Screen control
- Map Type control
- Rotate control
- Scale control
- Street View Pegman control
- Zoom control
Other options that can be set include:
- Clickable Icons
- Disable default UI
- Gesture Handling
- Heading
- Keyboard shortcuts
- Map Type
- Maximum Zoom level
- Minimum Zoom level
- Restrict search to Country
- Styles
- Tilt
- Zoom level
In addition, the plugin allows you to restrict the map to a set of bounds, via the Restrict to Bounds or Restrict to Bounds Strict Mode actions.
You can browse all the possible actions in the WIKI: https://github.com/jeffreykemp/jk64-plugin-reportmap/wiki/DA-Plugin-Attributes-Reference
Another enhancement included in this release is explicit support for the Table / View data source. This is simple to use, although not quite as flexible as the SQL Query option. Your table or view must include columns with the correct column names expected by the selected Visualisation – for example, if your Visualisation is Pins, the table or view must have columns named lat, lng, name and id. Click the Help tab on Table Name for more details, or review the WIKI (https://github.com/jeffreykemp/jk64-plugin-reportmap/wiki/SQL-Query-Examples).
NOTE: the plugin supports APEX 18.2 and later. It is no longer planned to include backports for older versions of APEX.
A big thanks to many APEX developers around the world who have installed and used the map plugin over the years. Your suggestions, questions and bug reports have contributed a great deal to improving the plugin.
About Jeffrey Kemp
Application Designer & Developer at Oracle specialising in Oracle APEX (Application Express), Oracle SQL and PL/SQL. Oracle ACE Alumni ♠️. Piano player, father, husband, Christian. The views expressed on this blog are my own and do not necessarily reflect the views of Oracle.
Abraham Zeri
10 August 2020 - 3:51 am
Hi Jeffrey,
First, I would like to say thank you very much for your contribution to the APEX community.
I am trying to customize a marker using your example. I am running into a couple of issues.
The first one is to customize the color of the icons based on a column with values (0 to 100). I am not that good at JS but here is my hacked code for it which is based on you example code. It just defaults to the last else statement. maybe it my JS code. The other issue is around scale. I wanted to use a dynamic scale based on a column value and tried to use your log scale, but it doesn’t seem to work for very big numbers.
this.options.markerFormatFn = function(marker) {

    var population = marker.data.attr01;
    var srate =     marker.data.attr02;

    // icon can be a Symbol
    if (srate > 95) {

     marker.icon = {
      path          : google.maps.SymbolPath.CIRCLE,
      fillColor     : "green",
      fillOpacity   : 0.6,
      strokeColor   : "white",
      strokeOpacity : 1,
      strokeWeight  : 0.5,
      scale         : population
    };

} else if (srate < 90) {
 marker.icon = {
    path          : google.maps.SymbolPath.CIRCLE,
      fillColor     : "yellow",
      fillOpacity   : 0.6,
      strokeColor   : "white",
      strokeOpacity : 1,
      strokeWeight  : 0.5,
      scale         : population
    };

} else {
marker.icon = {
      path          : google.maps.SymbolPath.CIRCLE,
      fillColor     : "red",
      fillOpacity   : 0.6,
      strokeColor   : "white",
      strokeOpacity : 1,
      strokeWeight  : 0.5,
      scale         : population
    };
}
}
Thanks again.
Abe
Jeffrey Kemp
10 August 2020 - 1:57 pm
Hi Abraham,
You may find you will need to diagnose your code – one way is to add some debug logging so you can see exactly what values are being used.
e.g.
this.options.markerFormatFn = function(marker) {
    var population = marker.data.attr01;
    var srate = marker.data.attr02;
    apex.debug("population", population, "srate", srate);
    ...
Run the page, and see what values are being evaluated at runtime in your browser console.
Jeff
Abraham Zeri
10 August 2020 - 3:16 pm
Hi Jeffrey,
Thanks for the debug tip. The data was showing up as undefined for the two variables because I didn’t have the right order of columns in the SQL query. Now everything works fine. Thanks again for your amazing plugin.
I don’t see a donate link on your web page. I do want to buy you a coffee :).
Thanks,
Abe
Jeffrey Kemp
10 August 2020 - 4:06 pm
Hi Abraham,
Great to hear. You’re very kind, and there’s no obligation – but there is a “Sponsor this project” link on the github page: https://github.com/jeffreykemp/jk64-plugin-reportmap
Jeff
Thay Ly
15 September 2020 - 5:07 am
Hi Jeff,
I am using one of your code for “Sync with Report” to display map in my application. Your code refer to map data loaded through INITDATA in the application process which is a static data set. How do I load the map data directly from JK64DEMO_COUNTIES table instead.
Please assist, your assistance with matter is very appreciative.
Thanks,
Thay
Jeffrey Kemp
15 September 2020 - 8:15 pm
Hi Thay,
You can base the report on a SQL query that retrieves data from any table you like. Change the SQL Query attribute on the plugin region to refer to the table of your choosing.
Jeff
Thay Ly
16 September 2020 - 1:33 am
Jeff,
It is working now after replace the query to retrieve data from jk64demo_countries_vw. I was trying to associate my query to populate data into the sample MAP collection that was loaded in the application process. Your technical tip save me lot times. Your plug-in is amazing which provide lot of features that are impossible for people like me to make it happen. Your contribution and your effort make other people life easier.
Thanks for a quick response
Thay Ly
Jeffrey Kemp
16 September 2020 - 7:33 am
Thanks Thay!
Thay Ly
5 October 2020 - 7:08 am
Jeff,
I had your Google Map Plus-in “demo_app_182.sql” installed under APEX v.19.1 with DB 19.3 and it worked fine. I just upgraded APEX to v.20.1 and the Demo map is no longer working. What do I need to update the code to be able to have the map work with the latest Oracle APEX version.
Please advise. Your assistance is very appreciative.
Thay Ly
Thanks
Jeffrey Kemp
5 October 2020 - 8:20 am
Hi Thay,
It should work after the upgrade with no changes. Please check the browser console log for any errors.
If that doesn’t help, please raise an issue and post a copy of the browser console log.
Thank you
Jeff
Kieran Dobson
23 April 2021 - 11:24 pm
Hi Jeff, is there any built in functionality to draw a mileage radius around a pin?
Thanks
Kieran
Jeffrey Kemp
26 April 2021 - 5:46 pm
Hi Kieran,
No built-in functionality, sorry. You could use the Google Maps JavaScript API to render a Circle (Circle example) object to do this. Note that the radius attribute is in meters so you would need to convert from miles.
I think you could create the new google.maps.Circle objects in the markerFormatFn – i.e. instead of just rendering a pin, you can draw a circle around it as well, centered at the lat, lng points of the pin with a radius derived from some other attribute in your data.
Jeff